How to collect, export, and visualise long-term data from your Solo CloudWatcher using Excel or similar tools.
Harold Wever shared a practical system for archiving and analysing CloudWatcher/Solo data over time. His setup uses:
/etc/cron.weekly, /etc/cron.daily, etc.).userdata.csv files are then imported into Excel for graphing and further analysis.The script itself is a short shell wrapper around the free dropbox_uploader.sh tool:
#!/bin/sh
cp /mnt/pen/userdata.csv /tmp
/home/aagsolo-orig/Dropbox-Uploader/dropbox_uploader.sh upload /mnt/pen/userdata.csv /
With all this, a new userdata.csv appears in the Dropbox folder; that file is imported into an Excel file, where some nice graphs are produced and other data analysis can be performed. The Excel file Harold created, along with some data, is available from here (password Harold Wever).
You may also want to check the Tweaking the Solo document if you have never modified your Solo.
Thanks Harold for sharing this!
The Solo writes several data files to its shared folder. The most useful for analysis are:
userdata.csv—timestamped log of all sensor readings, written to a USB pen drive (or to a NAS folder).aag_sld.dat—the "AAG Single Line Data" file, the one most automation software and ASCOM drivers point at.aag_sldc.dat—the same, but with a comma as the decimal separator.aag_dat.json—current readings in JSON format (useful for real-time integrations).For details on all available files and their structure, see the Tweaking the Solo guide:
Tweaking the Solo (PDF) ↗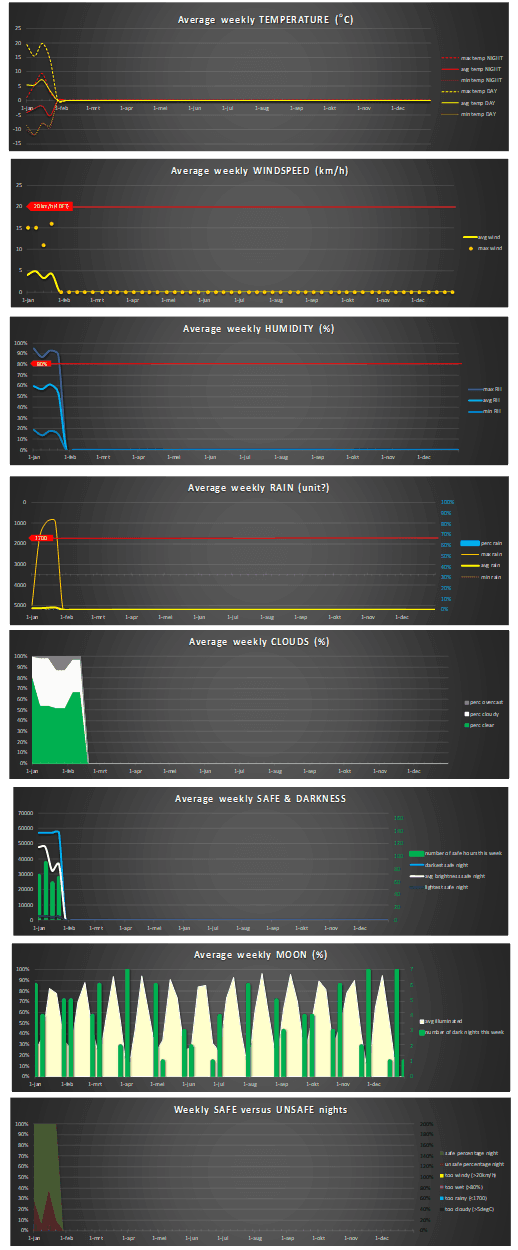
For more information, please read this forum post (you may need to register, it's free):
Re: Graphs and data analysis—Harold Wever ↗