
Legacy documentation. This guide still works, but it relates to discontinued or superseded software. It is kept for anyone running an older setup and is no longer part of the current CloudWatcher documentation.
The idea—graph images on a local web page
CloudWatcher software can output weather data as graph images—PNG or JPG files—on a configurable interval. The approach here is simple: run a lightweight local web server that serves a page containing those graph images, and point your browser at it.
The result is a minimal but functional weather dashboard you can check from your smartphone while in the house or garden, without installing any special app.
What you need
- CloudWatcher software (Windows) running on your observatory PC
- Savant 3.1—a free, lightweight Windows web server. Default root folder:
C:\savant\root - A simple HTML file in the server's root folder
Step 1—Install Savant
Savant 3.1 is a free web server, really easy to install and simple to configure. Installing it with the default options, it will set up a very simple but effective web server:
- serving at port http 80—that's the default port when you connect to a web page
- a
c:\savant\rootfolder where you can place your pages
To start with, you can remove everything in that folder—they are just sample files.
Step 2—Configure CloudWatcher graph output
Next thing to do is to configure the CloudWatcher to place its graphs into that folder. Just set the path to the web server root, as in the image. Leave the «Image PNG» as it is—you can uncheck it for the software to generate jpg image files instead.
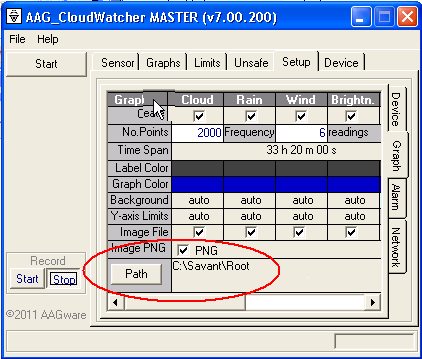
CloudWatcher can generate graphs for the following channels:
- Cloud cover
- Brightness
- Rain
- Temperature
- Wind speed
Step 3—Create the HTML index page
Last step here is to create our index.html file to ease the visualization of the graphs. Mine is as simple as this—you can just copy and paste this into your index.html file. The image names are relative to the server root, which is where you told the software to write the graphs in Step 2:
<HTML>
<HEAD>
<TITLE>AAG CloudWatcher minimalist server</TITLE>
</HEAD>
<BODY>
<CENTER>
<B><FONT FACE="Verdana"><FONT SIZE="-1">
Current conditions at - YOUR OBSERVATORY - as measured by the AAG CloudWatcher.</B><BR><BR>

Cloud cover<BR><IMG ALT="Cloud cover" SRC="AAG_ImageCloudCondition.png"><BR><BR>

Brightness<BR><IMG ALT="Brightness" SRC="AAG_ImageDayCondition.png"><BR><BR>

Rain<BR><IMG ALT="Rain" SRC="AAG_ImageRainCondition.png"><BR><BR>

Temperature<BR><IMG ALT="Temperature" SRC="AAG_ImageTemperature.png"><BR><BR>

Wind speed<BR><IMG ALT="Wind" SRC="AAG_ImageWindCond.png">
<BR><BR>
</CENTER>
</BODY>
</HTML>
Accessing the page
Now just try it: from another computer, or even the same one, launch your favourite web client (Google Chrome, Mozilla, Internet Explorer, Firefox, Safari, Opera…) and in the address bar key the name of the computer with the server. You'll see the just-created page loading and displaying the graphs.
The observatory PC's local IP address works just as well—for example, http://192.168.1.100.
If you are behind a router or firewall
And that's it. Well, almost. If your computer is, as happens to most of us, behind some kind of firewall / router or the like, you'll surely have to configure it. If it's of any help: in our router, we had to add a mapping, so incoming TCP/IP requests (from outside) were mapped to the internal computer with the AAG CloudWatcher and Savant web server.
In practice that means forwarding port 80 on your router to the observatory PC, in your router's administration interface under port forwarding or NAT settings. Once configured, you can reach the page via your public IP address or a dynamic DNS hostname.
There's plenty of information on the internet for each router, so hopefully that last step will be easily solved. We can't assist with routers, but any other question—as always, feel free to ask.
This is a deliberately minimal approach: no authentication, no security. Don't expose it to the internet without adding password protection if you have security concerns.