Cyclone Gabrielle — atmospheric record

The storm and the data

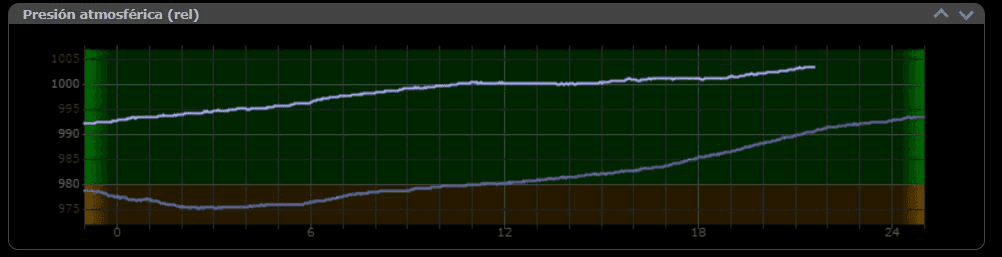
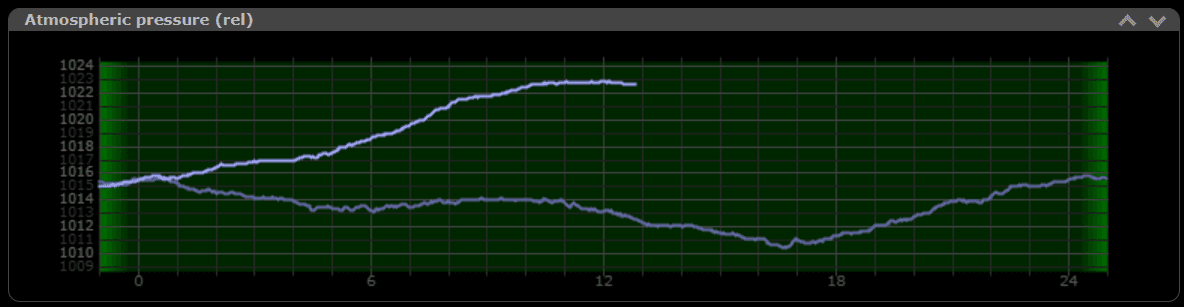
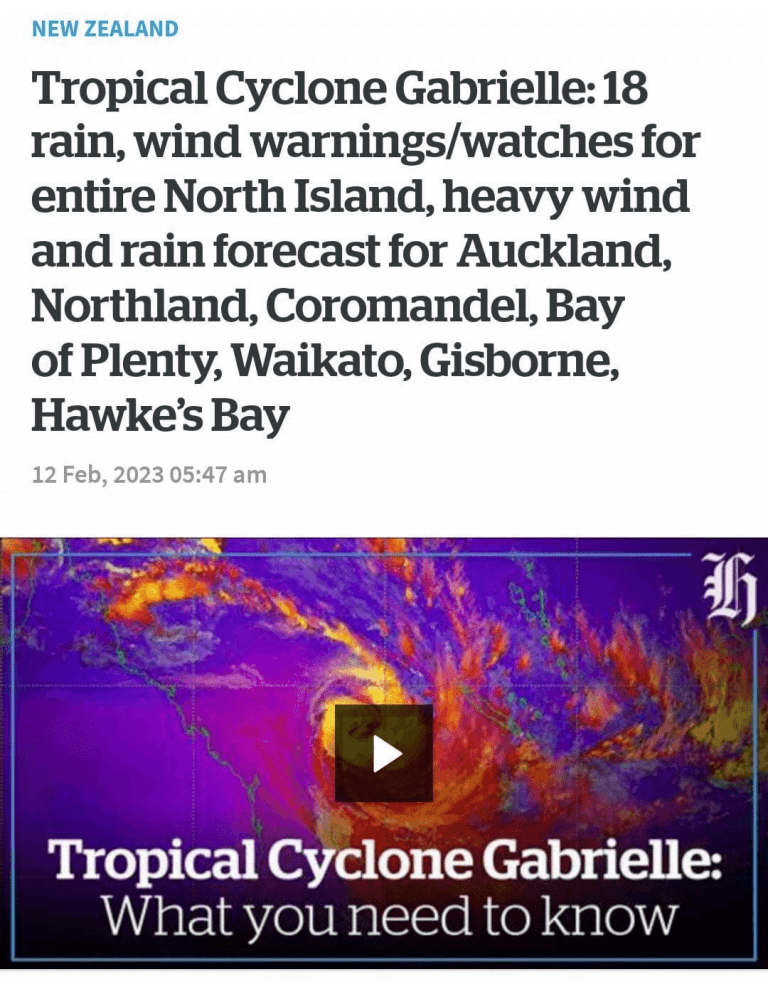
Cyclone Gabrielle was one of New Zealand's most significant weather events in decades, causing widespread flooding and damage across the North Island. The CloudWatcher in Hamilton recorded the classic pressure signature of a passing cyclone: a steep drop as the system approached, a brief trough at the centre, and a recovery as it moved away.

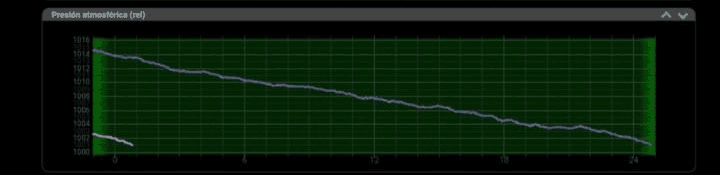
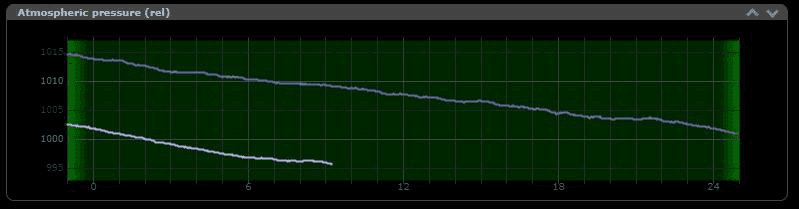
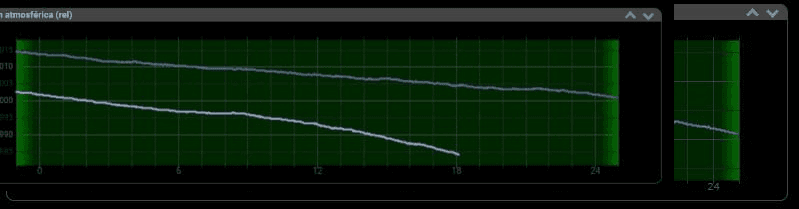
The device captured readings from February 13 to 17, documenting the complete atmospheric evolution of the storm. Pressure readings during the event show behaviour that is dramatically different from the normal day-to-day fluctuations the sensor typically records.

Simon Lewis — CloudWatcher operator, Hamilton, New Zealand
Simon Lewis operates the CloudWatcher unit in Hamilton, Waikato, whose data captured the cyclone.

Live data from the Hamilton CloudWatcher unit is available at aagsolo.lunatico.es:10800

A familiar measurement, an unfamiliar reading

For most of its life, a CloudWatcher atmospheric pressure sensor records the gentle daily oscillation between fair weather and passing fronts — variations of a few millibars over hours. During Cyclone Gabrielle, the same sensor recorded a drop many times larger than a typical weather pattern, compressed into a shorter time window.

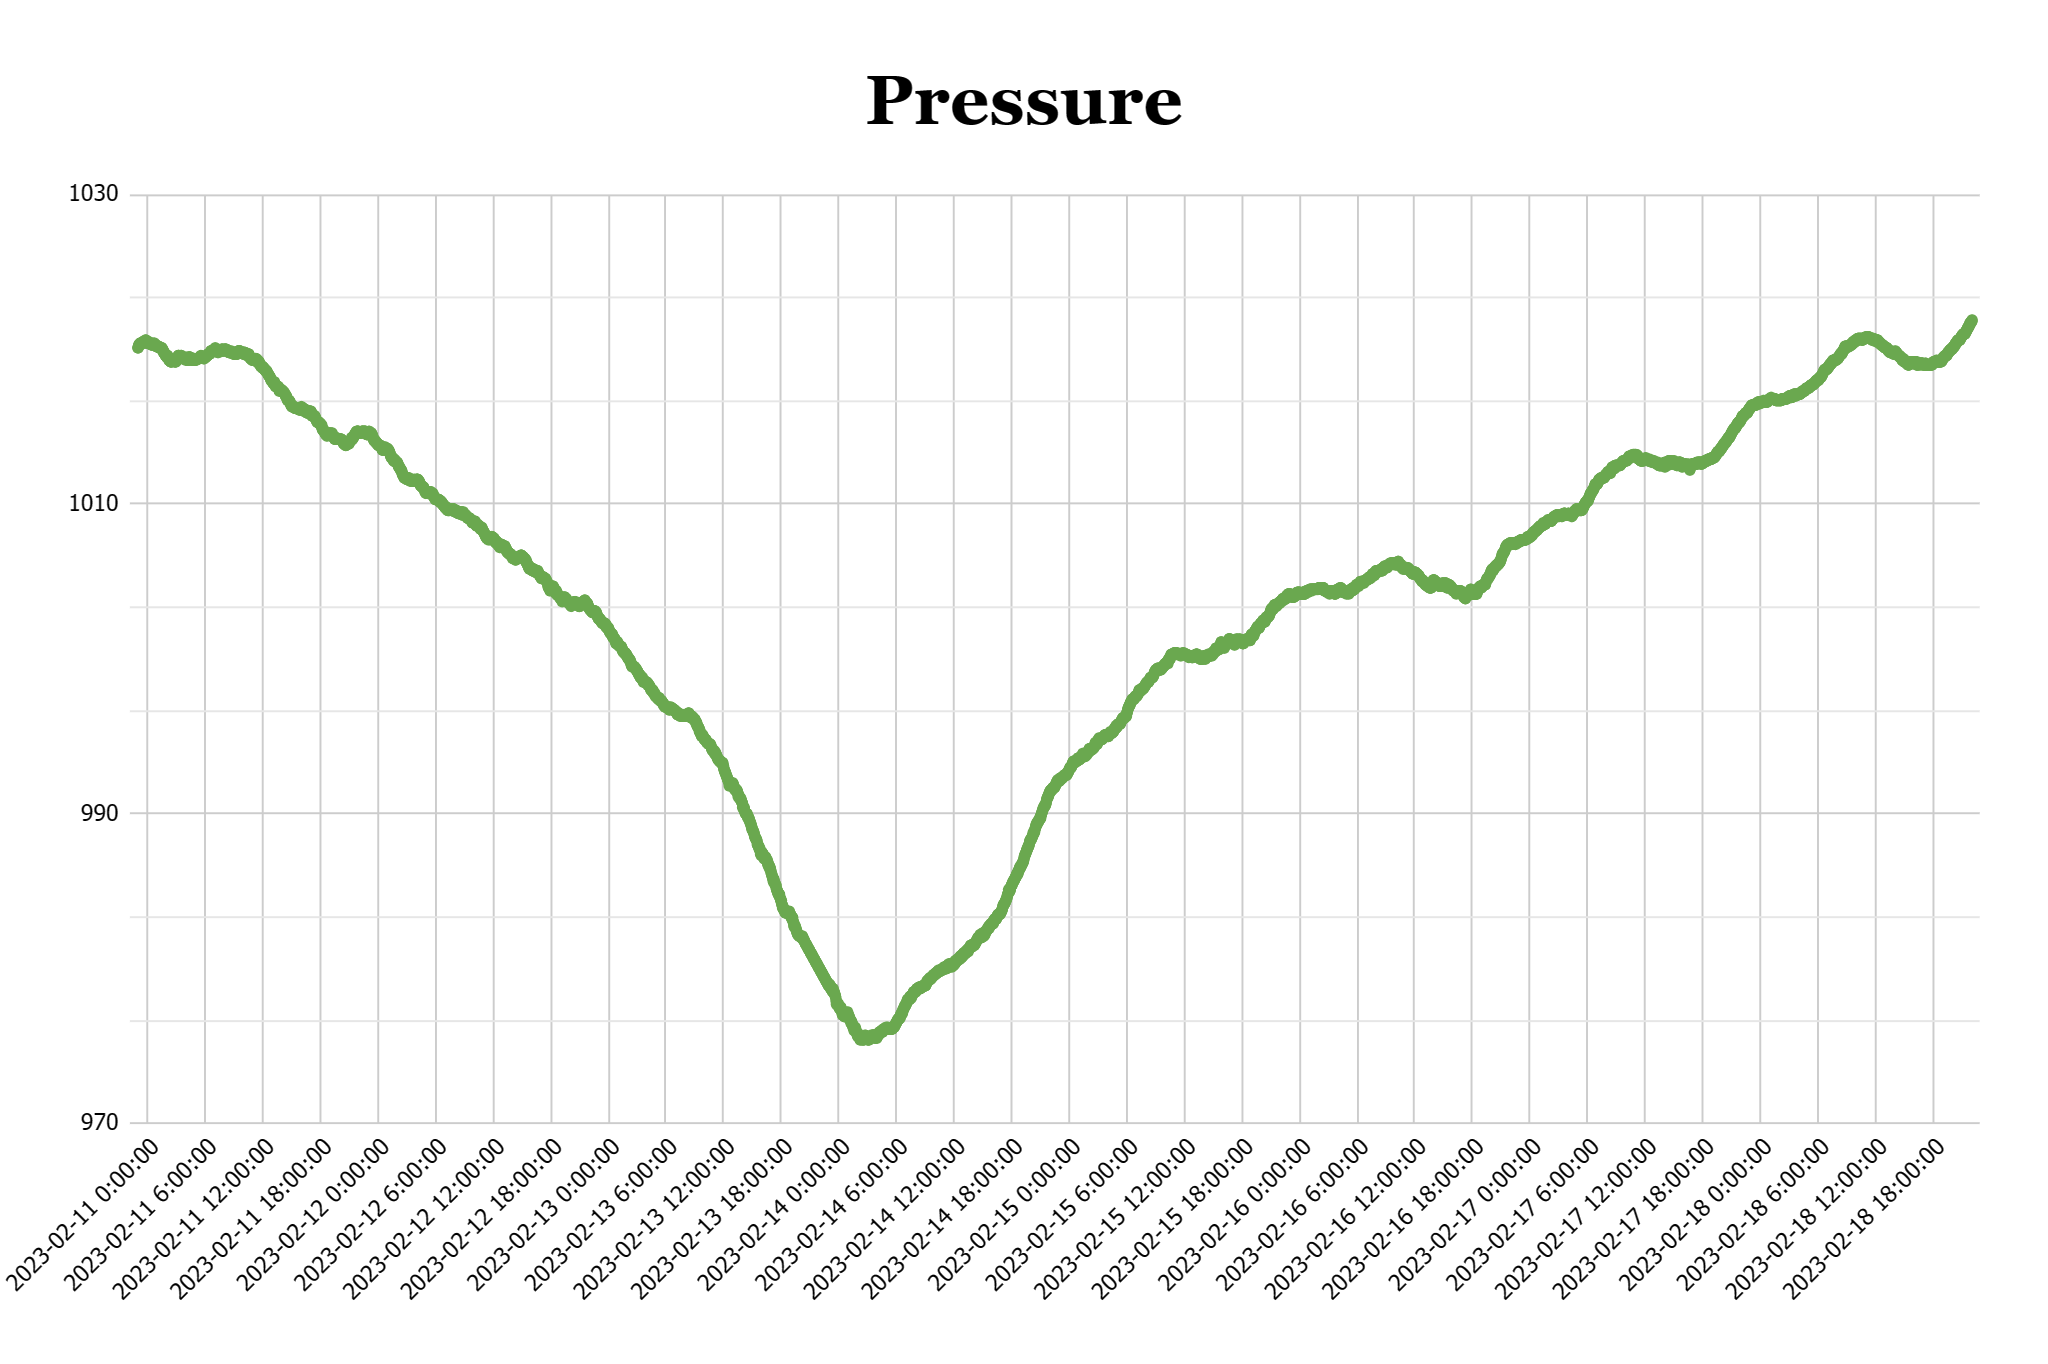
The combined pressure graph across the storm period makes the cyclone's passage immediately visible — there is no ambiguity about when the storm arrived or when it left.

Atmospheric pressure graph across Cyclone Gabrielle — CloudWatcher data
Atmospheric pressure recorded by the Hamilton CloudWatcher across the full storm period, February 13–17 2023.

Pressure readings — hour by hour

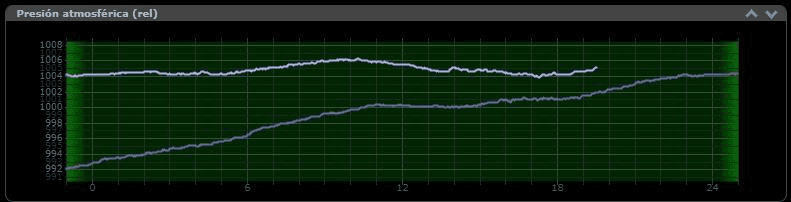
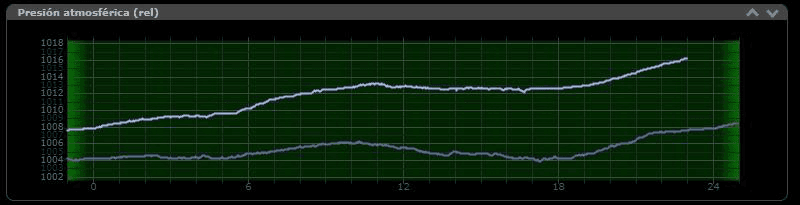
Snapshots of the SOLO interface at different points during the storm show how the pressure evolved through the night of February 13–14 — from the initial drop, through the lowest readings, and into the recovery phase.

CloudWatcher pressure reading 00:50 — Cyclone Gabrielle CloudWatcher pressure reading 09:18 — Cyclone Gabrielle CloudWatcher pressure reading 12:53 — Cyclone Gabrielle CloudWatcher pressure reading 18:18 — Cyclone Gabrielle CloudWatcher pressure reading 19:36 — Cyclone Gabrielle CloudWatcher pressure reading 21:43 — Cyclone Gabrielle
CloudWatcher pressure reading 23:03 — Cyclone Gabrielle

A record of extreme events

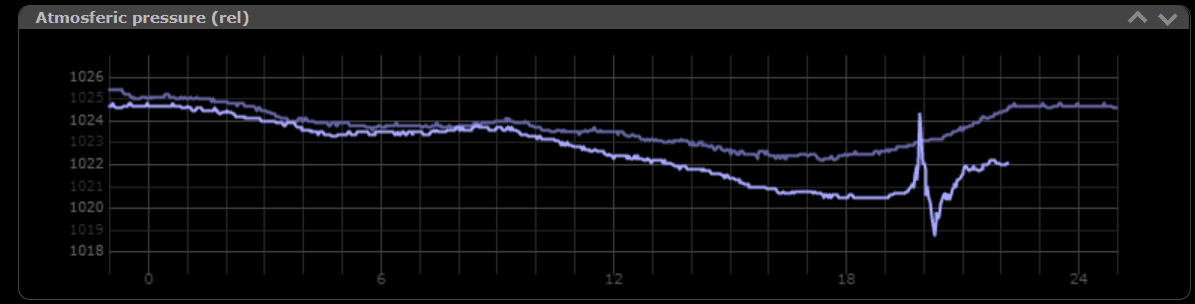
This is not the first time a Lunatico sensor has captured an extraordinary atmospheric event. The year before, in January 2022, the same instrument recorded the pressure wave from the Hunga Tonga volcanic eruption — a pressure pulse that circled the globe multiple times and was detectable by sensitive instruments worldwide.

Both events demonstrate how a CloudWatcher, deployed primarily for observatory safety, becomes an incidental scientific instrument during extreme meteorological events.

We extend our best wishes to all those who were affected by Cyclone Gabrielle, and to those who were still dealing with its consequences when this was written. Stay safe during severe meteorological events.