
Why it can be hard to tell at a glance
With all the options and situations, sometimes it's difficult to find out where last night's unsafe came from. This is specially true as the data in the user data file (or SOLO graphs) is summary data, not every single reading.
Making this more complex is the fact that both the safe after unsafe is probably delayed (safe condition delay), as well as the cloud detection may be delayed to avoid passing clouds (cloud alarm delay).
For users of the CW Windows software
With version 8.1.0 of the Windows software we've added an option to the user data file so you can find out what happened:
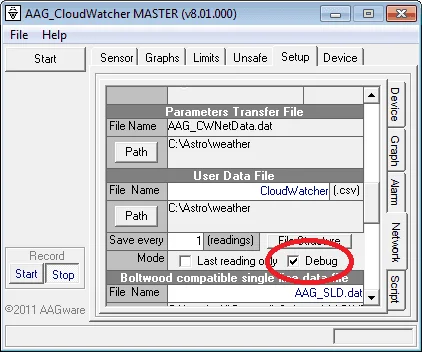
Don't forget to select a suitable (write-able!) folder for the file. Interleaved with the usual data, you'll find information about every unsafe detection, safe delay, activation, delayed cloud detection… everything.
Don't forget to click «Start» in the record section (lower left). The data is saved after some delay; if you want to check it live, clicking «Stop» then «Start» (again, record section) will force the file to be saved.
For SOLO users
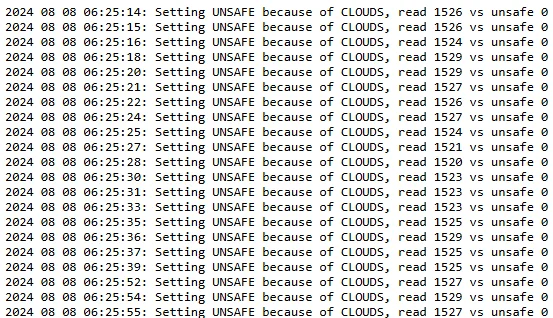
If you're using a SOLO CloudWatcher, check out this file:
http://aagsolo/cgi-bin/cgiGetDataFile?/tmp/debug.logCopy and paste it, and change aagsolo for the name of your device where necessary. Open the URL in any browser on the same network as the SOLO.
Common causes of unexpected UNSAFE signals
- Passing cloud—a single cloud moving across the sensor can trigger the cloud alarm, even if conditions are generally clear. Adjust the cloud alarm delay to suit your local sky.
- Rain sensor sensitivity—light dew or moisture from condensation can trigger the rain sensor. Adjust the sensitivity threshold if this is a recurring issue.
- Wind gusts—if your wind speed threshold is set low, brief gusts will trigger UNSAFE repeatedly.
- Sensor temperature drift—after sunrise or at dusk, rapid temperature changes can affect cloud temperature differential readings temporarily.
- Loss of communication—if the CloudWatcher loses communication with the PC, the «UNKNOWN generates UNSAFE» setting will trigger UNSAFE. Check the RS232 serial connection and its drivers.